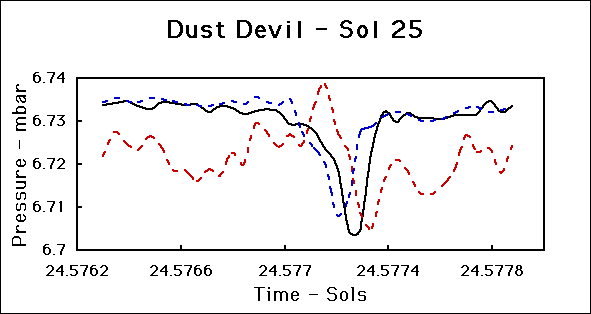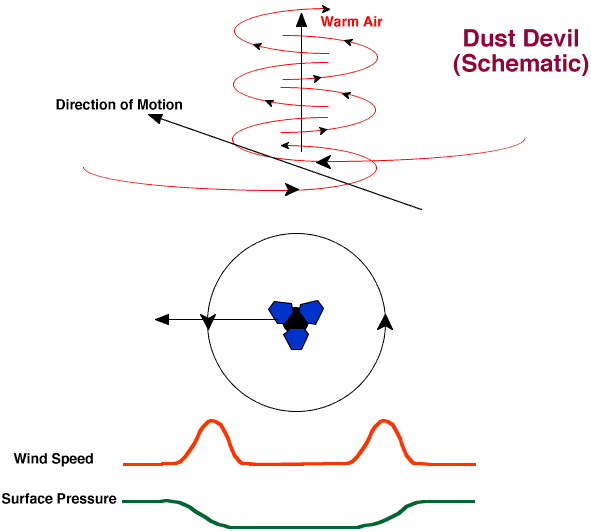

This graph shows the signature of a "dust-devil", a small atmospheric vortex which passed over the lander on sol 25. More of these signatures have been detected since that time. The black line shows the atmospheric pressure, the blue line shows the velocity of the east wind as measured by wind sensor 4, and the red line shows the west wind (sensor 1). The graph spans approximately 2 minutes, during which the east wind suddenly increases, the west wind and pressure drop, then as the dust devil passes by, the east wind drops and the west wind and pressure rise. Below is shown a schematic of a typical dust devil.

 Detailed information on the ASI/MET instrument
 Mars Pathfinder Preliminary Science Results
 Mars Pathfinder home page at NSSDCA